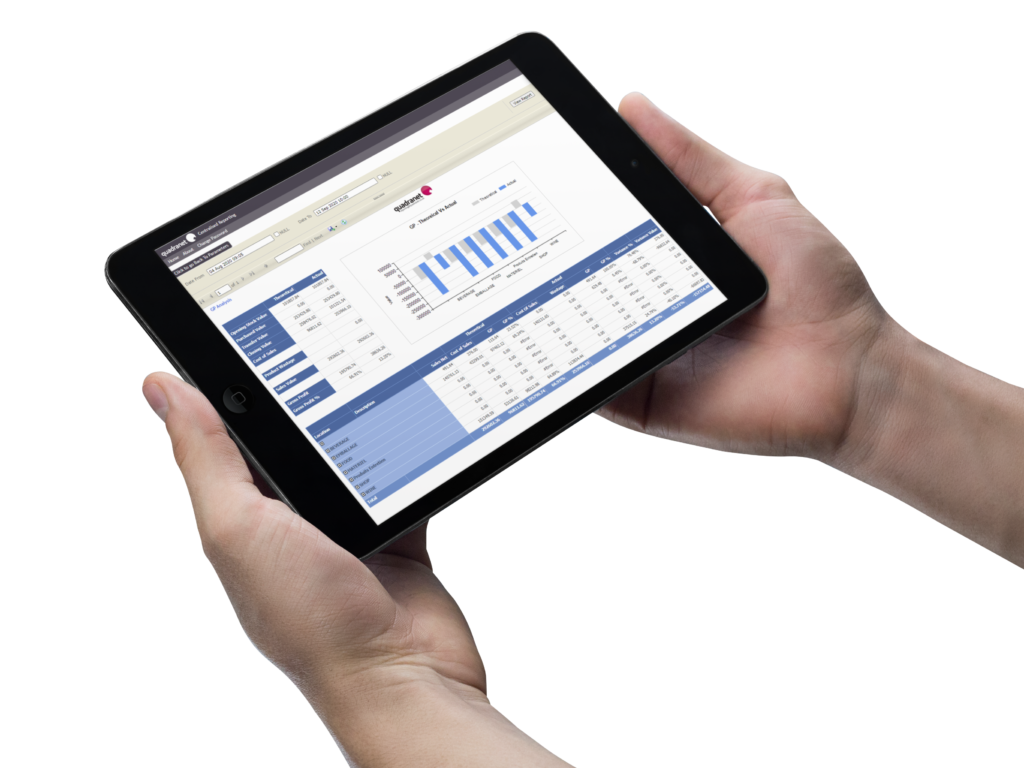
We can consume information with charts, reports and dashboards. But what if the numbers in the system are the start of a process to understand where the business is going. To look at trends, to control by checking against budget, to compare sites, to compare this year against last year…
Quadranet holds so much data and we want you to use it. Not only do we have epos data with sales and payments but we can match this to a reservation*. We can look at customer spend and see the customers’ favourite items.
*available with DBX
What about stock?
Stock systems show variances between actual closing stock and theoretical closing stock. Quadranet stock shows the ingredients for every sale. The cost of a dish is known and updated when an ingredient is delivered with a revised cost.
There is now accountability of a promotion. How many times have you heard “Lets reduce the price and we will make a bomb.”. In reality we know the squeezed margin means we are busy fools.
With the integration of DBX, EPOS and Stock; you know the sales, and you know the food costs.
We have a sack load of numbers. How do we use this to our customers benefit? We see four means of delivery:
1) Direct query via Excel. Pull off spreadsheets, giving you clean real data and pivot tables make manipulation easy. Try this new way of downloading data.
2) Mobile reports. DBX contains Reservations and POS. It can be accessed on any device, including the PED. Easy to read reports with charts and gauges.
3) Power BI. We have a Power BI platform, so you can consume real time aggregated data from Centralised Reporting.
4) Inspector Quadranet. Because we have the data as soon as the bill is closed we can look at the bill for known scams and email the restaurant immediately. So the guy who deleted an item after the bill is printed could well have the cash in his pocket, or the customer will still be there to ensure it was deleted with due cause.


